Inhomogeneous log formats on Linux
The field of log formats on Linux is as broad as heterogeneous: Different text-based log formats are generally not focused on being machine-readable, but rather aim to be quickly and easily readable with hand-held devices.
Syslog as a source of information
The Syslog is generally found in most cases either in journalctl or in /var/log/messages. While journalctl brings its own tools for reading, commands such as cat /var/log&/messages, tail -f /var/log/messages or more advanced grep statements are a good way to get at the desired information.
Using the same tools also allows access to other sources of information, such as the kernel log and extensive kernel interfaces in procfs and sysfs. In most cases, a thorough study of the Manpages is required for procfs and sysfs.
Although the content and format of popular representations like /proc/cpuinfo, /proc/mem or individual files in the /proc/<pid>-category are well-known by many developers, many of the other available files are rarely used and known. In addition the columns of numbers separated by spaces in some procfs interfaces can often be a source of frustration when parsing.
Additional sources
In addition to these sources, developers can also tap into other interfaces for gathering information. These can be classified as binary or machine-readable.
For example, the kernel's Netlink interface is often an underestimated candidate for retrieving important system information. Additionally, Berkly Packet Filters are gaining more attention and promise to provide exciting insights into the running system in the future.
Furthermore, there are numerous user-space interfaces that offer a wide range of options. Any program can create its own interface by providing Sockets, Pipes, Files, or Shared Memory, following the philosophy "everything is a file". The variety of mechanisms is large and is made even more complicated by the formats used.
Middleware and standards such as DBus only provide limited countermeasures to this vast variety of options.
Unsatisfactory an a generic problem
This shows that extracting important system information from Linux logs is time-consuming and unsatisfactory. Additionally, it is a generic issue that many developers will encounter in their work.
But the defined and controlled reaction to specific events in error or normal cases is mandatory for embedded systems. Therefore, emlix developers, as part of a customer project with Elektrobit, sought a good solution within the open-source community. Unfortunately, no luck – The team found no solution that met the requirements.
A solution had to be found
So it was only natural for the emlix developers to create a suitable solution themselves, which would also be made available to the open-source community.
Central requirements were that the system should be automatically monitored and appropriately react to specific events.
By this point, there were further requirements to evaluate all the previously mentioned sources and moreover
- to assess them
- to interpret their output
- to prepare for a specific use case
- to validate the origin of an event
- and finally to react to the event
In addition, the events that occur should be permanently stored and the recorded interfaces should be easy to maintain and monitor.
With these requirements, the elos project was born.
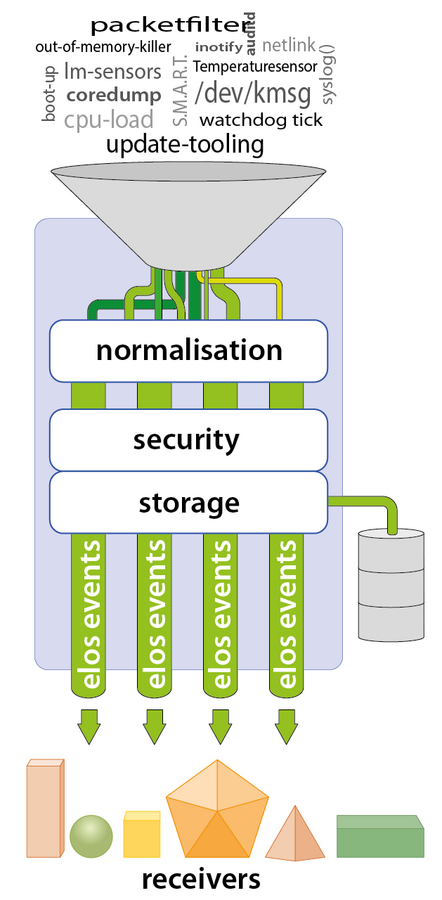
elos: An Open-Source event logging and management system
After a year of open source, elos now comes with the following features:
- Event Normalisation: Converts system events into a machine-readable format for easy processing
- Gathering - Event scanning: Provides a robust concept for collecting and publishing events
- Open IPC Architecture: Extensible through a client API over any IPC (Inter-Process Communication) interface
- Security Evaluation: Determines which events can come from which source
- Persistence: Implements an adaptive storage concept, answering the questions of "What", "How", and "Where" data is stored
Event normalisation
The goal is to determine the meaning of an event as clearly and trivially as possible. For example, an EEACCESS error on an open system call can be interpreted as "file does not exist" or "file is inaccessible".
A typical Syslog entry follows this format:
<Severity Level> <Date> <Time> <Program ID>: <Event Description>
In this case, the entry might look like
<38>Jan 1 00:00:04 myapp[98]: Failed to open file
In <38>, we see that the information contains coded details about the message, indicating it's an INFO-level log with a Facility of Security (Syslog terminology).
Furthermore, we can identify the process that originated this event and its corresponding Process ID via myapp[98]. The actual event is coded as 'Failed to open File'."
However, the event description itself is encoded in a way that requires parsing and understanding, which can be an unnecessarily complex task.
elos Event formats
The elos event format aims to avoid having to re-interpret text every time, while also making it as efficient as possible to interpret and evaluate events for machines.
The simplest way is to compare a number or symbol. Inspired by the successful HTTP response code system, it's also suitable to use integer codes for events, such as 4004 translating to "FILE_NOT_FOUND". Ideally, the error from our example would be translated to this format. Additional attributes can further specify and add meaning to the central statement.
The elos event format provides the following attributes:
- Date: Timestamp of the event
- MessageCode: A simple numerical identifier for an event (e.g. 4004)
- Classification: A 64-bit field for classification, annotation of events
- Severity: For grouping by severity or urgency of events
- HardwareID: A unique system identifier to assign it to a specific system
- Source: The origin trigger of the event, usually the process itself
- Payload: Additional information for the event
All attributes are optional, except for Date. If an event lacks temporal encoding, elos sets the time of arrival in the elos system.
Date
All attributes are optional, except for Date. If an event lacks temporal encoding, elos sets the time of arrival in the elos system.
Classification
The Classification bit field allows events to be assigned to multiple categories. This categorization of events enables analysis of events before and after an event has occurred. It allows all security-relevant events related to hardware in a network context to be described using an event filter.
Payload und Message-Code
The Payload field allows an event to provide additional information, where the Message-Code determines the content and format of the event.
Normalisation
In summary, these 7 attributes are the smallest common denominator for bringing events into a unified, comparable context. This normalisation ensures that the costs for interpreting events are minimized. Following the philosophy "Complete one task correctly", applications can focus on their core task, while elos handles the acquisition and interpretation of necessary information.
Gathering - event scanning
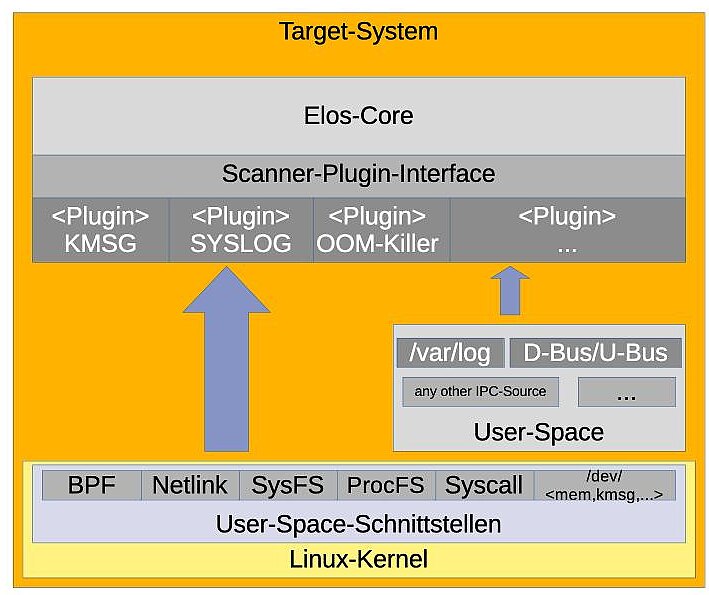
elos uses so-called scanner plugins to monitor different event sources in a system. The scanner plugin approach offers a flexible way to transform various sources for information centrally into elos events.
Scanners are implemented as plugins, which are activated and configured via the elosd configuration. Similarly to other plugin types (client and storage plugins), a scanner plugin abstracts the way an event resource is read and interpreted from.
Event resources for scanners can be diverse and include everything from Unix sockets such as /dev/log (syslog scanner) to character devices like /dev/kmsg, up to network link endpoints like AUDIT.
Using the elos plugin API, it's also possible to implement your own scanners. These allow developers outside of the elos sources and independent of the elos kernel and other components to build and maintain them.
Base scanners
elos currently brings the following base-scanners for monitoring:
- Syslog
- Linux Kernel Ringbuffer
- Out-of-Memory Killer
...
    "Scanner": {
        "Plugins": {
            "OomKiller": {
                "File": "scanner_oomkiller.so",
                "Run": "always"
            },
            "SyslogScanner": {
                "File": "scanner_syslog.so",
                "Run": "always",
                "Config": {
                    "SyslogPath": "/dev/log",
                    "MappingRules": {
                        "MessageCodes": {
                            "8004": ".event.source.appName 'sshd' STRCMP .e.payload r'authentication failure' REGEX AND",
                            "8005": ".event.source.appName 'sshd' STRCMP .e.payload r'Accepted password for' REGEX AND",
                            "1001": "1 1 EQ"
                        }
                    }
                }
            },
            "KmsgScanner": {
                "File": "scanner_kmsg.so",
                "Run": "always",
                "Config": {
                    "KmsgFile": "/dev/kmsg"
                }
            }
        }
    }
...
Open IPC Architecture: Providing a client API over various IPC interfaces
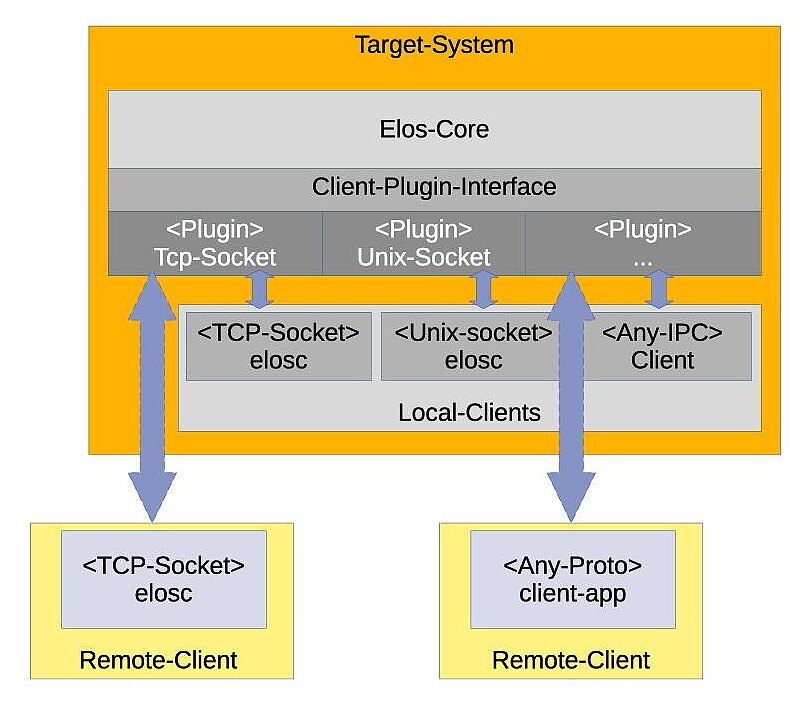
elos follows an approach to event-driven architectures. To support the most straightforward integration of different combinations of IPC solutions in a system, a plugin-based system is also employed here.
This allows the required IPC mechanisms to be used depending on the system configuration. Here, elos acts as a traditional message broker, and events are exchanged following the Publish/Subscriber principle. As a result, this allows to implement client plugins for basic interfaces such as Shared Memory, Unix Domain Sockets, up to additional middleware like DBus, Ubus, MQTT, and OPCUA.
Independently of the specific IPC attachment, a client has principal interactions:
- Publishing of events
- Subscription to events
- Fetching of recent events
Depending on the implementation of the client plugin, not all functions need to be provided. elos provides a TCP-based client plugin as an IPC mechanism in its basic configuration. With this plugin alone, more complex scenarios can be configured, such as local and public interfaces.
...
    "LocalTcpClient": {
        "File": "client_tcp.so",
        "Run": "always",
        "Config": {
            "Port": 54321,
            "Interface": "127.0.0.1",
            ...
        }
    },
...
    "PublicTcpClient": {
        "File": "client_tcp.so",
        "Run": "always",
        "Config": {
            "Port": 54322,
            "Interface": "192.168.192.4",
            ...
        }
    },
...
For simple development, elos offers libelos and libelos-cpp with a C++ API that abstracts the communication details with elos. Additional language bindings, such as Python, Go, and Rust, are in the pipeline and can be quickly implemented thanks to the simplified elos protocol, which is easy to implement in modern languages.
Security Evaluation – Event Authorisation and Blacklisting
The propagation of events in a system raises the aspect of auditing events, as it's essential to prevent unwanted or incorrectly published events that could affect critical processes or initiate actions. Therefore, it must be ensured that only events from authorized sources are accepted. In elos, this is achieved through a combination of event blacklisting and event authorisation.
Event Blacklisting
In elos, the configuration allows the creation of an event blacklist. This occurs on a per-client-input basis, in the form of an event filter. If an event is identified by the blacklist or matches the event filter, the sending process must be authorised to successfully publish the event. If this is not the case, a security event 8007 (UNAUTHORIZED_PUBLISHING) will be published and logged instead.
...
    "LocalTcpClient": {
        "File": "client_tcp.so",
        "Run": "always",
        "Config": {
            "Port": 54321,
            "Interface": "127.0.0.1",
            ...
            "EventBlacklist": ".event.messageCode 1000 LE",
            ...
        }
    },
...
    "PublicTcpClient": {
        "File": "client_tcp.so",
        "Run": "always",
        "Config": {
            "Port": 54322,
            "Interface": "0.0.0.0",
            "EventBlacklist": "1 1 EQ",
            ...
        }
    },
...
Event Authorisation
Processes that are deemed authorised can publish events on the blacklist. Authorised processes are defined in a similar manner to the event blacklist. In contrast, a list of process filters is defined, and a process must meet one of these filters in order to be considered authorised.
Definition of Process Filters, illustrated with an example of a public and private TCP-client-plugin instance:
...
    "LocalTcpClient": {
        "File": "client_tcp.so",
        "Run": "always",
        "Config": {
            "Port": 54321,
            "Interface": "127.0.0.1",
            ...
            "authorizedProcesses": [
                ".process.uid 0 EQ .process.gid 0 EQ AND .process.exec '/usr/bin/elosc' STRCMP AND",
                ".process.gid 200 EQ .process.exec '/usr/bin/elosc' STRCMP AND",
                ".process.pid 1 EQ"
            ]
            ...
        }
    },
...
    "PublicTcpClient": {
        "File": "client_tcp.so",
        "Run": "always",
        "Config": {
            "Port": 54322,
            "Interface": "0.0.0.0",
            ...
            "authorizedProcesses": [],
            ...
        }
    },
...
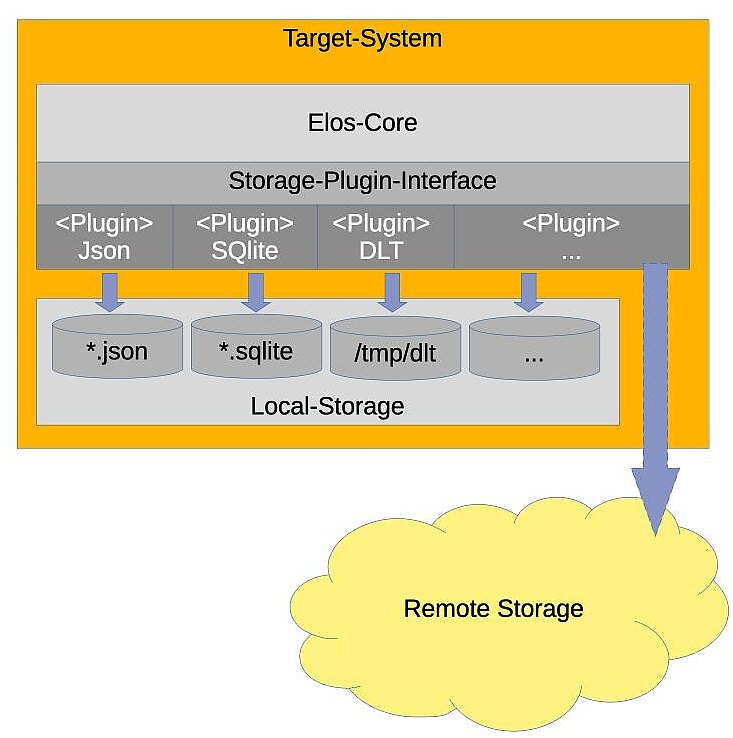
Persistence: Adaptive storage system
Once the events have been recorded, normalised and authorised, the next task is persistence. Simply writing away all events as they occur, would result in high system load, large amounts of data, and a corresponding strain on underlying storage media. For the task of persistence the following aspects have to be considered:
- What should or can be explicitly excluded from storage
- How to store data in a way that is gentle on hardware, particularly flash storage
- How to optimize events storing for later evaluation
Taking these factors into account, emlix has introduced a classification system to achieve optimal storage:
- How frequently do events occur?
- How sensitive is the information?
- How long does it need to remain available?
This allows different classes of storage to be derived.
For example, sensitive information should be stored on an encrypted partition. Frequent events like system temperature or system load should be stored in a lightweight tmpfs or an optimized Timeseries Database. Meanwhile, events related to hardware failures should be stored in a rotating log file on a traditional partition.
To accommodate the different nature of these storage classes, emlix has decided to develop a modular system and implemented Storage Plugins. Each plugin defines how events are stored (Plain-Text, Binary format, or Database). The configuration of an instance of a plugin determines which events to store and also the storage medium used.
The extension through plugins allows new storage technologies to be added without altering the core elos kernel.
elos provides default JSON-, SQLite-, and DLT-Plugin (Diagnostic Log and Trace) out-of-the-box. It can also extend these with custom, specialized storage plugins in C/C++ using its elos Plugin API.
Here is an example of a JSON log file configuration for Coredumps and another for all other events with severity Warning or higher:
...
    "syslog": {
        "File": "backend_json.so",
        "Run": "always",
        "Filter": [
            ".e.severity 3 LE .e.severity 0 GT AND"
        ],
        "Config": {
            "StoragePath": "/var/log/syslog_%host%_%date%_%count%.log",
        }
    },
    "coredump": {
        "File": "backend_json.so",
        "Run": "always",
        "Filter": [
            ".e.messageCode 5005 EQ"
        ],
        "Config": {
            "StoragePath": "/mnt/coredumps/coredumps_%host%_%date%_%count%.log",
        }
    },
...
The adaptable approach enables system integrators to dynamically route events to the most appropriate storage format and location, tailored to the specific circumstances and application requirements.
One year of open source - elos continues to grow
Since last year, elos has been available as an open source project on GitHub under the MIT License. Beyond the core elos repository, a small ecosystem has emerged:
- elos-plugin: Example Plugins
- meta-elos: A Yocto meta-layer for embedded projects
- Ubuntu PPA
- Arch Linux
Going forward, emlix aims to expand elos into new areas, including:
- Expanding scanner capabilities for:
- Hardware monitoring
- Process and system monitoring
- Network monitoring
- Enhanced IPC (Inter-Process Communication) support:
- Unix domain sockets
- Optional standard interfaces, such as OPC-UA default device profiles
- Expanding and improving the elos development and plugin ecosystem
- Enhancing integration with systemd/journald
Even as a comparatively young project, elos already offers approaches and concepts that can make Linux systems more efficient - not only in the embedded area, but also for desktop applications or server systems.
Further Information
If you would like to know more about elos and the possible applications, we look forward to hearing from you.
Your contact person
The elos Team
Phone +49 551 304460
solutions@~@emlix.com